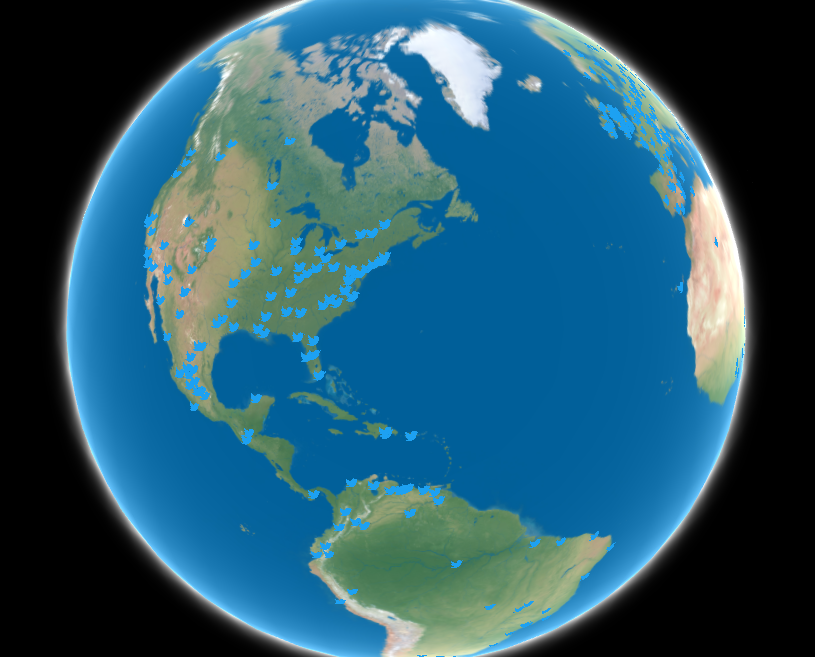
Twitter Trends Globe
Data visualization of all available trending locations of the Twitter API using WebGL Globe
Built with Python Flask
This web page displays a globe with all of the available trend locations provided by the Twitter API. This globe makes it easier to visualize which locations are currently available for accessing trend data. This globe can also be used to see which locations are still not available for access, and this may be useful for developers to see which locations are still in need of trending data access.
Project Details
Date: Oct 30, 2016
Author: Ryuji Mano
Categories: project
Tagged:
Client: